How to Calculate Rental Property ROI: 4 Methods Compared
There are four ways to measure rental property ROI — cap rate, cash-on-cash return, total ROI, and IRR. Learn when to use each, see worked examples with real numbers, and understand what the results actually mean.
“What’s the ROI on this rental property?” is a question that sounds simple but doesn’t have a single answer. Return on investment means different things depending on which method you use — and each method tells you something different about the deal.
Use cap rate to compare properties quickly and ignore financing. Use cash-on-cash return to see what your cash is actually earning after debt service. Use total ROI for a complete picture over a defined holding period. Use IRR when you want to account for the time value of money and variable cash flows.
This guide walks through all four methods with the same example property so you can see how the numbers differ and when each metric is most useful.
The Example Property
We’ll use one property throughout:
- Purchase price: $220,000
- Down payment (25%): $55,000
- Loan amount: $165,000 at 7.5% for 30 years
- Monthly mortgage (P&I): $1,155
- Monthly rent: $2,000
- Closing costs at purchase: $5,200
- Initial repairs: $3,000
- Total cash invested: $55,000 + $5,200 + $3,000 = $63,200
Monthly operating expenses (excluding mortgage):
- Property taxes: $280/month
- Insurance: $120/month
- Property management (8%): $160/month
- Maintenance reserve: $150/month
- Vacancy allowance (5%): $100/month
- Total operating expenses: $810/month
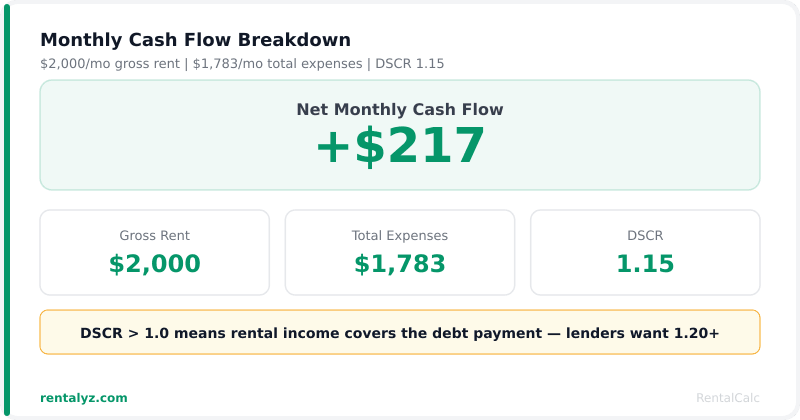
Monthly cash flow: $2,000 − $1,155 − $810 = $35/month Annual cash flow: $35 × 12 = $420/year
Now let’s calculate the ROI four ways.
Method 1: Cap Rate
Formula: Cap Rate = NOI ÷ Property Value × 100
Step 1 — Calculate NOI:
- Annual gross rent: $24,000
- Less vacancy (5%): −$1,200
- Less operating expenses (excluding mortgage): −$8,520
- Annual NOI: $14,280
Step 2 — Divide by purchase price: $14,280 ÷ $220,000 × 100 = 6.5% cap rate
What it tells you: The property generates 6.5 cents of operating income for every dollar of value. This is a property-level metric — it says nothing about your financing or actual cash return.
When to use it: Quick comparisons across properties and markets. “Is this a 5-cap deal or a 7-cap deal?” answers the question without getting into mortgage math.
Limitations: Ignores financing entirely. Two investors who use different mortgages on the same property will calculate the same cap rate but have very different cash flows and returns.
Method 2: Cash-on-Cash Return
Formula: Cash-on-Cash Return = Annual Pre-Tax Cash Flow ÷ Total Cash Invested × 100
Using our numbers:
- Annual pre-tax cash flow: $420
- Total cash invested: $63,200
$420 ÷ $63,200 × 100 = 0.66%
That’s a very low cash-on-cash return — nearly zero. Why? Because we’re in a higher-rate environment where the mortgage rate (7.5%) exceeds the cap rate (6.5%). This is negative leverage: using debt makes the cash-on-cash return lower than the cap rate.
What it tells you: How much cash your cash is earning right now. This is the most relevant metric for investors who are dependent on cash flow from day one.
When to use it: When financing matters and you need to know whether the deal produces usable cash flow today.
Limitations: Doesn’t capture appreciation, equity paydown, or rent growth over time. Can be misleadingly low in year 1 if you have financing at rates above the cap rate.
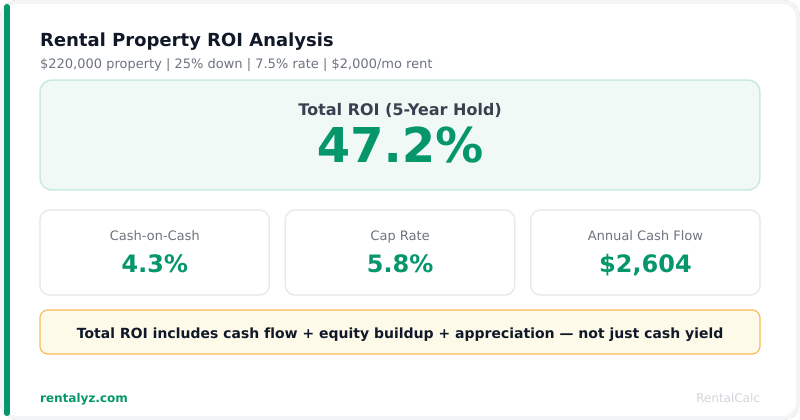
Method 3: Total ROI (Holding Period Return)
Total ROI captures everything that happens over your hold period: cash flow, appreciation, and equity paydown from mortgage amortization.
Let’s calculate for a 5-year hold:
Year 1–5 cumulative cash flow: $420/year × 5 = $2,100 (simplified — ignoring rent growth for now)
Equity paydown (loan amortization):
In year 1 of a $165,000 loan at 7.5%/30 years, you pay about $1,300 in principal. Over 5 years, cumulative principal paydown is approximately $7,200.
Appreciation:
Assuming 3% annual appreciation on the $220,000 purchase price:
- Year 1: $226,600
- Year 2: $233,398
- Year 3: $240,400
- Year 4: $247,612
- Year 5: $255,040
Appreciation gain: $255,040 − $220,000 = $35,040
Total return calculation:
| Component | Amount |
|---|---|
| Cumulative cash flow | $2,100 |
| Principal paydown | $7,200 |
| Appreciation | $35,040 |
| Total gain | $44,340 |
Total ROI = $44,340 ÷ $63,200 × 100 = 70.2% over 5 years
Annualized simple ROI: 70.2% ÷ 5 = 14.0% per year
What it tells you: The complete picture of investment return over your hold period — including the wealth-building components that cash-on-cash misses.
When to use it: When evaluating whether a property makes sense as a long-term investment, even if current cash flow is thin.
Limitations: Depends heavily on appreciation assumptions. Change the appreciation rate from 3% to 1% and the numbers look very different. Always run scenarios.
Total ROI Sensitivity Analysis (5-Year Hold)
| Appreciation Rate | Total Gain | Total ROI | Annualized |
|---|---|---|---|
| 0% (no appreciation) | $9,300 | 14.7% | 2.9% |
| 2% | $24,400 | 38.6% | 7.7% |
| 3% | $44,340 | 70.2% | 14.0% |
| 5% | $72,800 | 115.2% | 23.0% |
At zero appreciation, this property barely returns anything. At 3%, it looks attractive. This is the key insight: in many markets, appreciation — not cash flow — drives the bulk of rental property returns.
Method 4: Internal Rate of Return (IRR)
IRR is the most sophisticated measure. It’s the discount rate that makes the net present value (NPV) of all cash flows equal to zero, accounting for the time value of money.
In plain English: IRR answers the question “what compound annual growth rate would I need to earn on my investment to match these cash flows?”
Cash flows for IRR calculation (5-year hold):
| Year | Cash Flow |
|---|---|
| Year 0 (initial investment) | −$63,200 |
| Year 1 | $420 |
| Year 2 | $432 (2% rent growth) |
| Year 3 | $1,644 (higher rent growth) |
| Year 4 | $1,700 |
| Year 5 | $1,758 + sale proceeds |
Sale proceeds at year 5:
- Sale price: $255,040 (3% annual appreciation)
- Less selling costs (6%): −$15,302
- Less remaining loan balance (~$157,800): −$157,800
- Net proceeds: $81,938
Year 5 total cash flow: $1,758 + $81,938 = $83,696
Running these through an IRR calculation (use Excel’s IRR function or a financial calculator):
- Year 0: −$63,200
- Year 1–4: $420–$1,700
- Year 5: $83,696
IRR ≈ 9.2%
What it tells you: A single annualized return figure that accounts for when cash flows occur — earlier cash flows are worth more than later ones. If your IRR exceeds your hurdle rate (the minimum return you require), the deal works.
When to use it: Comparing deals with different cash flow profiles over time. Also useful for evaluating whether to hold or sell — compare the IRR of continuing to hold against the IRR of reinvesting the proceeds elsewhere.
Limitations: Requires assumptions about future cash flows and sale price. Also technically assumes reinvestment at the same IRR rate, which may be unrealistic.
Which Method Should You Use?
| Situation | Best Metric |
|---|---|
| Quick deal screening | Cap Rate |
| Current cash flow analysis | Cash-on-Cash Return |
| Buy-and-hold investment evaluation | Total ROI |
| Comparing deals with different profiles | IRR |
| Deciding whether to sell or hold | IRR |
| Presenting to lenders or partners | Cap Rate + DSCR |
The honest answer: use all of them. Cap rate tells you the property’s income efficiency. Cash-on-cash tells you your current yield. Total ROI and IRR tell you where you’ll be over time.
The Metrics No Single ROI Figure Captures
Every ROI calculation captures a return on invested dollars. What it doesn’t fully capture:
Tax benefits from depreciation. Residential rental property is depreciated over 27.5 years. On a $220,000 property with 80% allocated to the structure: $176,000 ÷ 27.5 = $6,400/year in paper losses. This can offset other income and shelter cash flow from taxes — effectively increasing after-tax return by 20%–35% depending on your tax bracket.
Forced appreciation from improvements. If you add an ADU or make strategic improvements, you can drive appreciation faster than the market average.
Rent growth compounding. The example above used flat rent in Year 1 and modest growth. If rents grow 3%/year, the cash flow picture improves meaningfully by Year 5–10.
Portfolio leverage. Each property builds equity you can eventually pull out to buy the next one. The return on a portfolio isn’t just the sum of individual deals — it compounds.
Airbnb vs Long-Term Rental: A Side-by-Side Comparison
How do these ROI methods look when you compare long-term and short-term rental strategies on the same property? The infographic below uses a $300,000 property to show the difference:
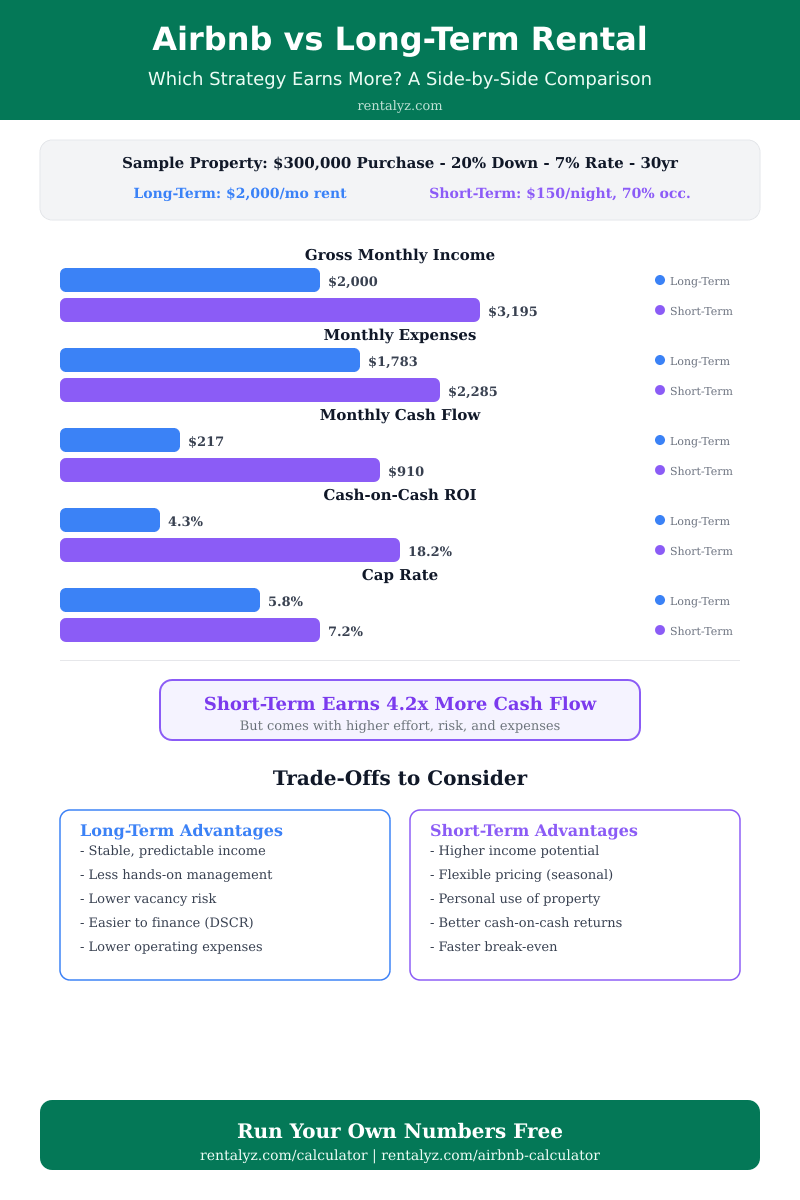
Short-term rentals can generate significantly higher cash flow, but they come with more work, higher expenses, and greater income volatility. Run your own comparison using our rental property calculator and Airbnb calculator.
Frequently Asked Questions
Q: What is a good ROI for a rental property?
A 6%–8% cap rate is solid for most markets. A 6%–10% cash-on-cash return is a common target. A 10%–15% annualized total ROI including appreciation is considered strong for long-term holds.
Q: How do you calculate ROI on a rental property?
Simplest form: (Annual Cash Flow + Annual Appreciation + Annual Equity Paydown) ÷ Total Cash Invested × 100. For accuracy over time, use IRR.
Q: Is cash-on-cash return the same as ROI?
No. Cash-on-cash measures only current cash yield. Total ROI includes appreciation and equity paydown as well.
Q: Does rental property ROI include appreciation?
Only if you’re using total ROI or IRR. Cap rate and cash-on-cash are income-only metrics that ignore appreciation.
Calculate Your Rental Property ROI
Our free calculator handles cap rate, cash-on-cash return, 5-year projections, and more — no signup required.