Cash-on-Cash Return Explained: Formula, Examples & What's Good
Cash-on-cash return measures how much cash a rental property earns relative to your actual cash investment. Learn the formula, see real examples, and understand what benchmarks to target.
Cash-on-cash return is the metric that tells you how hard your money is actually working. Unlike cap rate, it accounts for the mortgage — so it measures the real cash yield you earn on the dollars you put into a deal.
If you put $50,000 down on a rental property and it generates $3,500 in annual cash flow after all expenses and the mortgage payment, your cash-on-cash return is 7%. That’s the number you compare against what your money could earn elsewhere.
The Cash-on-Cash Return Formula
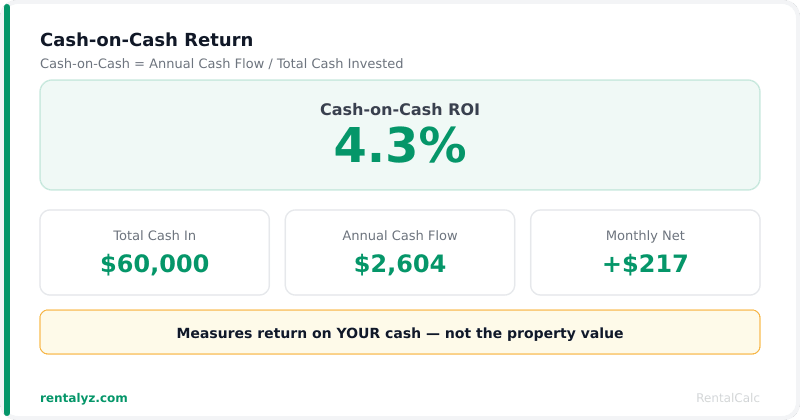
Cash-on-Cash Return = Annual Pre-Tax Cash Flow ÷ Total Cash Invested × 100
Annual Pre-Tax Cash Flow is rent minus everything: operating expenses, vacancy, property management, and the full mortgage payment (PITI — principal, interest, taxes, insurance).
Total Cash Invested is all cash you actually spent to acquire the property: down payment, closing costs, any upfront repairs or staging, and initial reserves. Not the purchase price — the actual cash out of your pocket.
Step-by-Step Calculation
1. Calculate annual cash flow:
| Line Item | Monthly | Annual |
|---|---|---|
| Gross Rental Income | $2,000 | $24,000 |
| Less: Vacancy (5%) | −$100 | −$1,200 |
| Less: Property Management (8%) | −$160 | −$1,920 |
| Less: Maintenance Reserve | −$150 | −$1,800 |
| Less: Insurance | −$100 | −$1,200 |
| Less: Property Taxes | −$250 | −$3,000 |
| Less: Mortgage (P&I) | −$970 | −$11,640 |
| Monthly Cash Flow | $270 | $3,240 |
2. Calculate total cash invested:
| Item | Amount |
|---|---|
| Down payment (20%) | $40,000 |
| Closing costs | $4,200 |
| Initial repairs | $2,500 |
| Reserves (3 months) | $2,400 |
| Total Cash Invested | $49,100 |
3. Calculate cash-on-cash return:
$3,240 ÷ $49,100 × 100 = 6.6%
Worked Examples
Example 1: Standard Long-Term Rental
- Purchase price: $185,000
- Down payment (25%): $46,250
- Closing costs: $4,800
- Total cash in: $51,050
- Monthly rent: $1,850
- Monthly expenses (all-in including mortgage): $1,565
- Monthly cash flow: $285 → $3,420/year
- Cash-on-Cash Return: $3,420 ÷ $51,050 = 6.7%
Example 2: Small Multifamily Duplex
- Purchase price: $310,000
- Down payment (25%): $77,500
- Closing costs + minor repairs: $8,200
- Total cash in: $85,700
- Combined monthly rent: $3,200
- Monthly expenses (all-in including mortgage): $2,625
- Monthly cash flow: $575 → $6,900/year
- Cash-on-Cash Return: $6,900 ÷ $85,700 = 8.1%
Example 3: High-Cost Market Condo
- Purchase price: $520,000
- Down payment (20%): $104,000
- Closing costs: $9,000
- Total cash in: $113,000
- Monthly rent: $3,200
- Monthly expenses (all-in including mortgage + HOA): $3,180
- Monthly cash flow: $20 → $240/year
- Cash-on-Cash Return: $240 ÷ $113,000 = 0.2%
The condo example illustrates a common scenario in expensive coastal markets: the cash flow is nearly zero, so investors are essentially betting entirely on appreciation.
Example 4: BRRRR Deal (Recycled Capital)
After a BRRRR refinance that returns most of your capital:
- Total cash left in deal after refinance: $12,000
- Annual cash flow: $2,400/year
- Cash-on-Cash Return: $2,400 ÷ $12,000 = 20%
When a BRRRR deal recycles most of your capital, the cash-on-cash return on remaining equity becomes very high — which is the appeal of the strategy.
What Is a Good Cash-on-Cash Return?
There’s no universal answer, but here are the benchmarks most investors use:
| Cash-on-Cash Return | Interpretation |
|---|---|
| Below 4% | Thin; usually a bet on appreciation |
| 4%–6% | Acceptable in appreciating markets |
| 6%–8% | Solid; competitive with other investments |
| 8%–12% | Strong; excellent for rentals |
| Above 12% | Exceptional; high risk or BRRRR/creative financing |
Compare to your alternatives. If a stock index fund has returned 10% annually, a 5% cash-on-cash return only makes sense if you believe appreciation, equity paydown, and tax benefits make up the difference. They often do — but know what you’re getting.
Compare within your market. A 6% cash-on-cash return in a market where cap rates compress and appreciation runs 5%/year is very different from 6% in a flat market with no appreciation.
Cash-on-Cash Return vs. Cap Rate
These two metrics often confuse new investors. Here’s the key difference:
Cap rate ignores financing. It measures the property’s income yield at its value, independent of how you paid for it. Two investors who buy the same property — one all-cash, one with a mortgage — would calculate the same cap rate but different cash-on-cash returns.
Cash-on-cash includes the mortgage. It measures your actual cash return on your actual cash investment. Leverage (using a mortgage) typically amplifies cash-on-cash return when the cap rate exceeds the mortgage interest rate.
Example of leverage amplification:
- Property: $200,000 purchase price, $13,000 NOI (6.5% cap rate)
- All-cash: Cash-on-cash = 6.5% (same as cap rate)
- 25% down at 7.5% rate: Mortgage ≈ $10,560/year P&I; Cash flow = $13,000 − $10,560 = $2,440; Cash invested = $50,000 + $5,000 closing = $55,000; Cash-on-cash = $2,440 ÷ $55,000 = 4.4%
In this case, leverage reduced cash-on-cash return because the mortgage rate (7.5%) exceeded the cap rate (6.5%). This is called negative leverage — common in today’s higher-rate environment.
When the cap rate exceeds the mortgage rate (positive leverage), using a mortgage increases cash-on-cash return.
How to Improve Cash-on-Cash Return
Increase rent. The most direct lever. $100/month more rent = $1,200/year more cash flow.
Reduce vacancy. A month of vacancy at $2,000/month costs $2,000 in annual income. Screen tenants well, price competitively, and minimize turnover.
Reduce operating expenses. Self-manage (saves 8%–10%), shop insurance annually, negotiate service contracts.
Increase down payment (carefully). Counterintuitively, a larger down payment reduces the mortgage and increases cash flow — but it also increases total cash invested. The net effect on cash-on-cash depends on the specific numbers.
Reduce purchase price. Lower price = smaller loan = lower mortgage payment = higher cash flow. Negotiation, off-market deals, and BRRRR all help here.
Add units or income streams. ADUs, storage rental, parking, coin laundry, and similar additions increase income without proportional expense growth.
What Cash-on-Cash Doesn’t Capture
Cash-on-cash is a snapshot of current cash yield. It misses several important components of total return:
- Appreciation. If the property increases in value 4%/year, that’s a $8,000 annual gain on a $200,000 property — often larger than the cash flow itself.
- Equity paydown. Every mortgage payment builds equity. In year 1 of a 30-year mortgage, a small portion goes to principal; by year 10, it’s significant.
- Tax benefits. Depreciation deductions can shelter rental income, effectively increasing after-tax cash-on-cash return.
- Rent growth. As rents increase over time, cash flow grows — but cash-on-cash is calculated at today’s numbers.
For a complete picture, combine cash-on-cash with total ROI or IRR analysis. Cash-on-cash answers: “What am I earning today?” Total ROI answers: “What will this investment return over time?”
Frequently Asked Questions
Q: What is a good cash-on-cash return for rental property?
Most investors target 6%–10%. Below 4% is thin unless strong appreciation is expected. Above 10% is excellent but often involves higher risk or creative financing.
Q: Does cash-on-cash return include mortgage payments?
Yes. Cash-on-cash uses pre-tax cash flow after debt service — the mortgage is subtracted. This is what separates it from cap rate, which ignores financing entirely.
Q: What’s the difference between cash-on-cash and ROI?
Cash-on-cash measures current cash yield only. Total ROI adds appreciation, equity paydown, and tax benefits for a complete long-term picture.
Q: Can cash-on-cash return be negative?
Yes — if expenses and mortgage exceed rent. Some investors accept this in strong appreciation markets, betting on future value growth.
Calculate Cash-on-Cash Return
Run the numbers on your deal with our free cash-on-cash calculator — no signup needed.